JetBrains IDE
- ローカル
- リモート
Cascade では、IDE から直接診断情報ファイルを生成できるようになりました。方法は 2 つあります。
- Cascade ウィンドウ右上の 3 点をクリックし、Download 診断情報 を選択します
- IDE メニューで Tools > Windsurf > Download Windsurf 診断情報 に移動します
VS Code
-
Command Palette を開きます (
Ctrl/Cmd + Shift + Pを押すか、View > Command Palette に移動) - 「Show logs」と入力し、「Developer: Show Logs」と表示されるオプションを選択します
- 右上の「Extension Host」と表示されているドロップダウンを「Windsurf」に変更します
- 以下の画像のように表示されます。
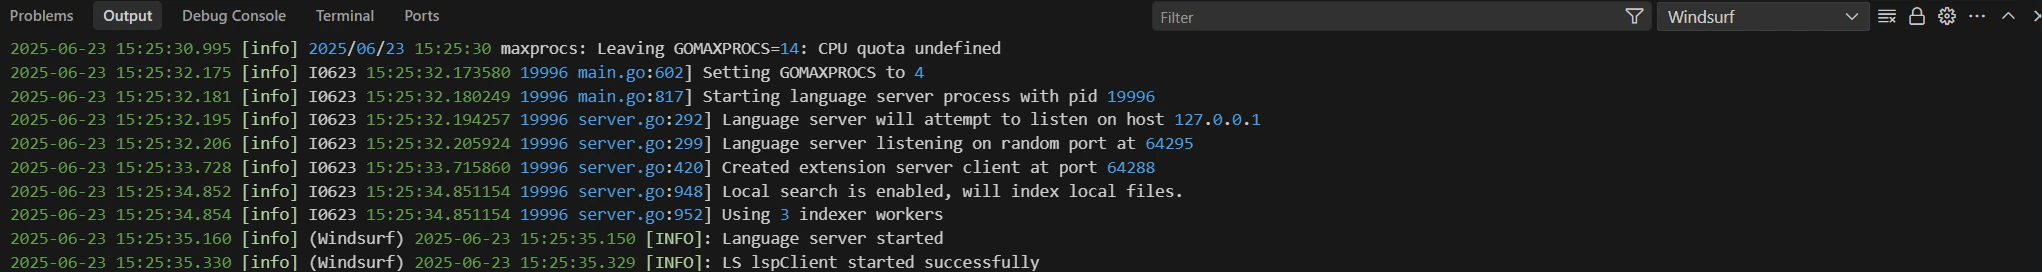
- ログをエクスポートするか、コピーします
Eclipse
- Mac/Linux: ~/.codeium/codeium.log
- Windows:
C:\Users\<username>\.codeium\codeium.log
Visual Studio
NeoVim
g:codeium_log_file にファイルパスを設定し、vim を再起動します。
すると、ログがそのファイルに書き込まれます。