Improving Code Coverage With Devin
Most applications in production don’t have 100% code coverage. Engineering teams have to ruthlessly prioritize, and tend to focus on writing tests for critical paths to get the most benefit out of their time spent. Devin can bridge this gap by analyzing a codebase’s existing test suite style and increasing coverage of less critical but still important functions. For this example, we’re going to take an open source Typescript sample application based on the RealWorld spec which already has some tests but not comprehensive coverage: https://github.com/SeuRonao/realworld-express-prisma You can follow along with the full Run here or you can read through the rest of this post highlighting each step of Devin’s process. We’ll be highlighting various parts of Devin’s Workspace like the Editor or Shell.Initial Prompt
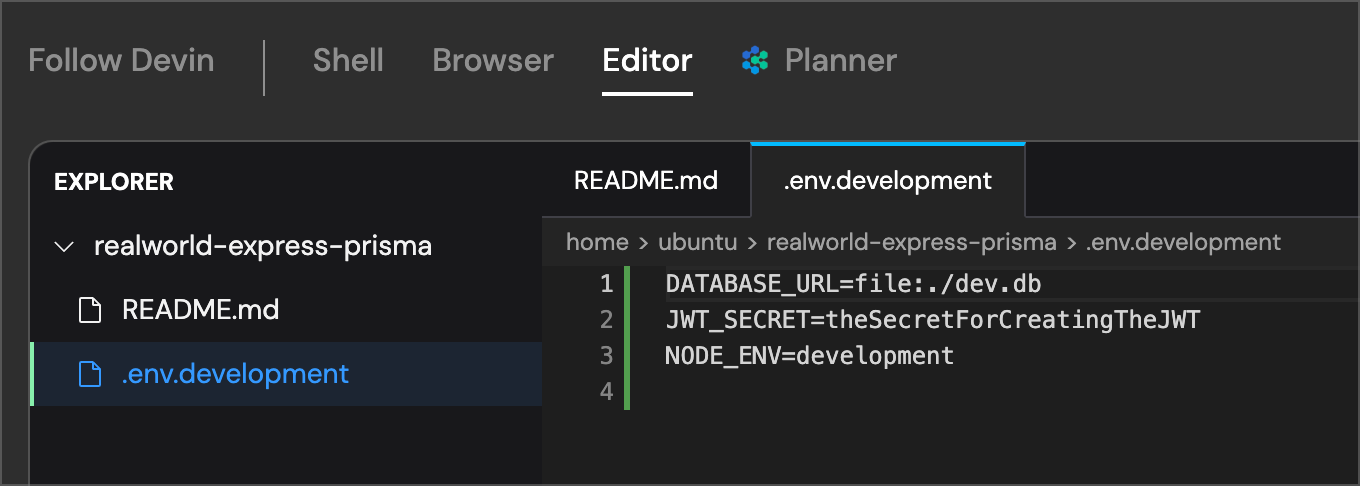
We start off our Run with a simple prompt directing Devin to set up our dev environment and assess the existing code coverage of our application: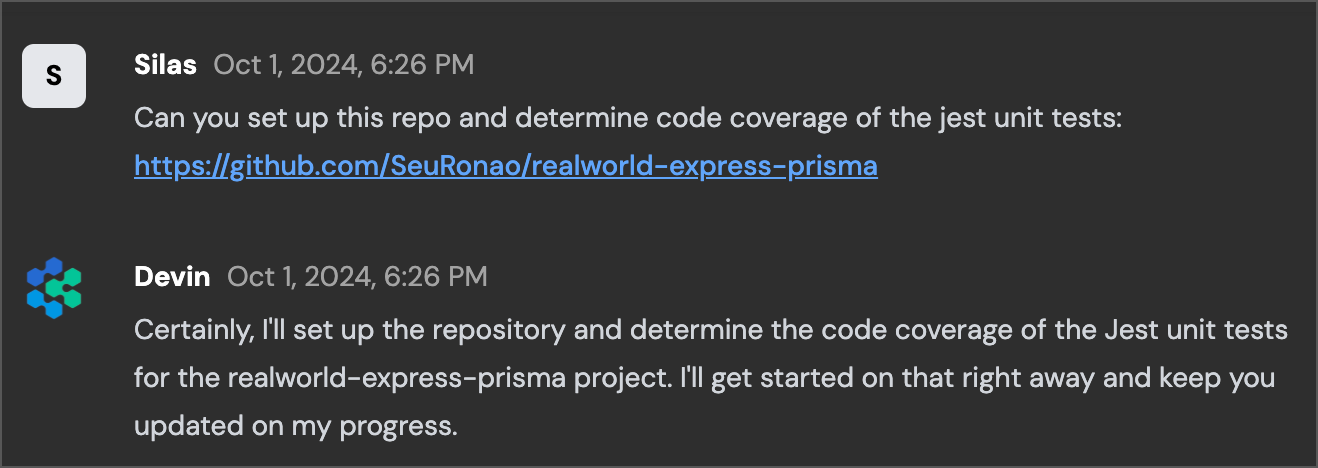
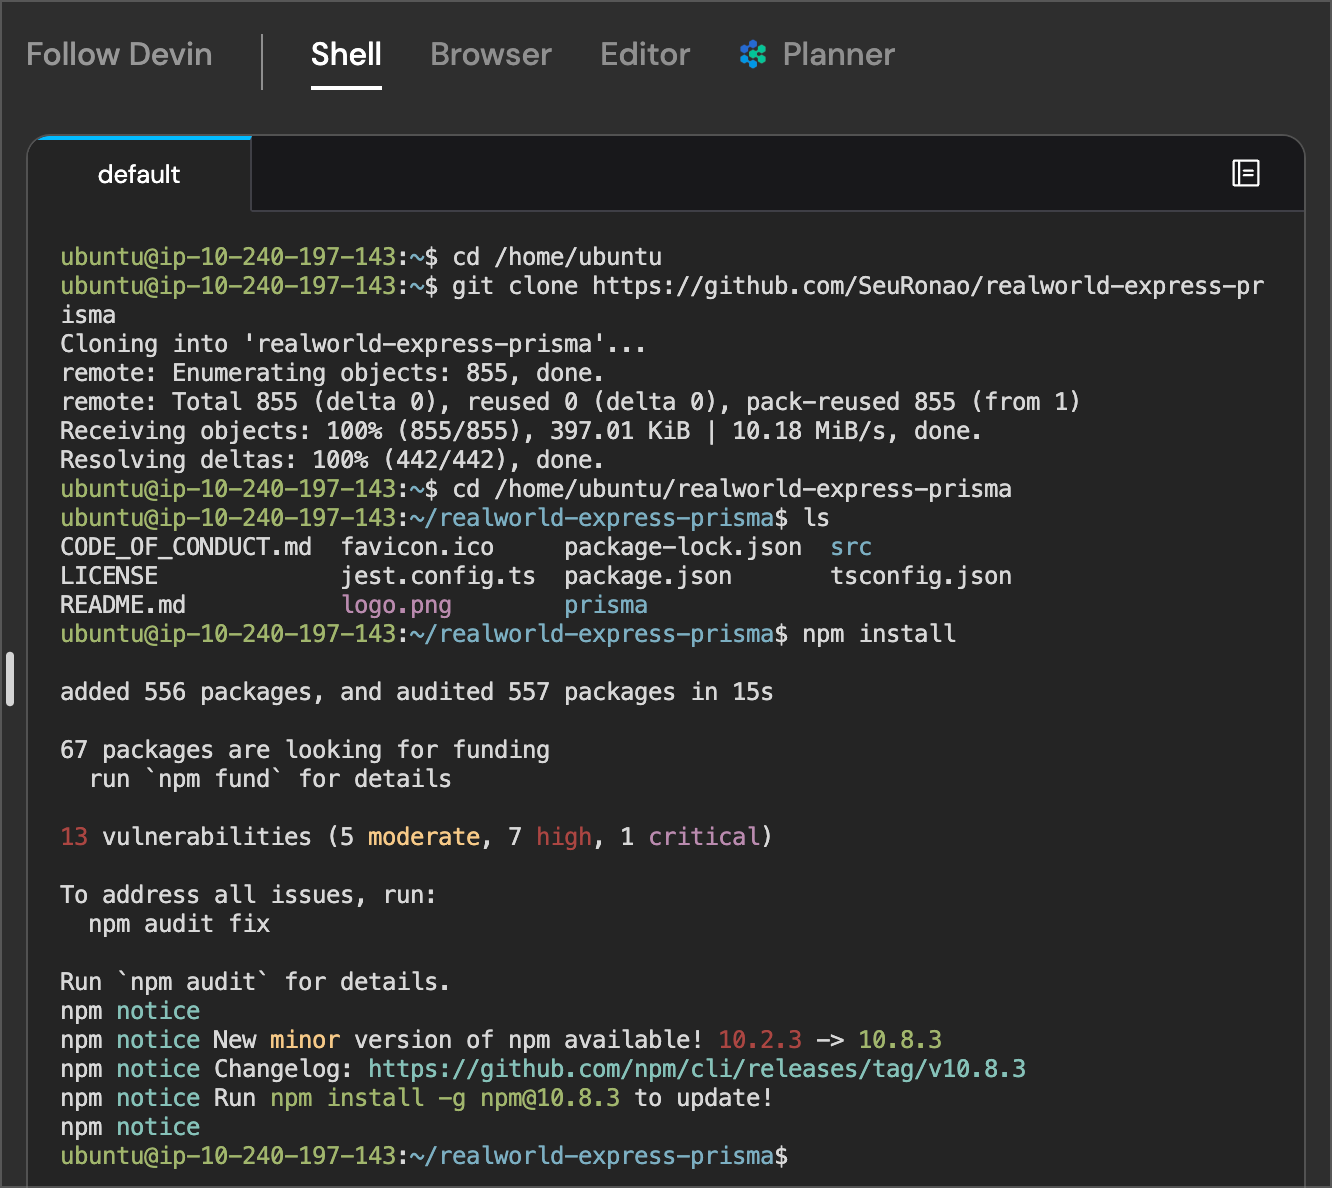
Establishing a Coverage Baseline
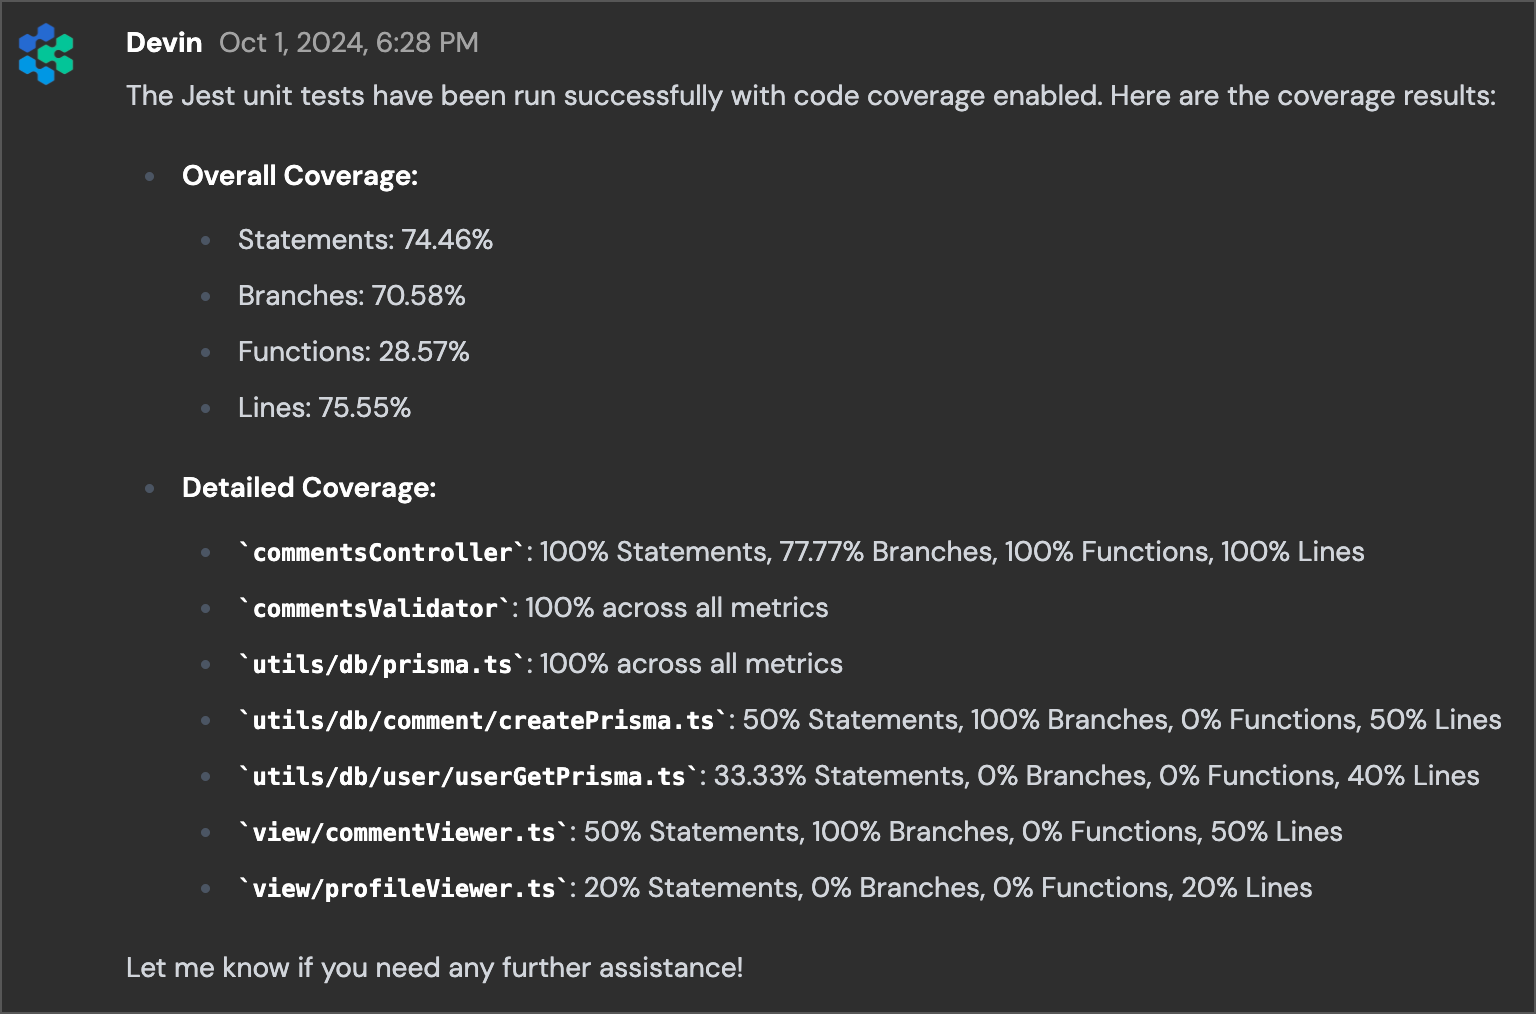
Devin then runs the test suite in its Shell. One of the major benefits of Devin is that it not only can modify or create code for your team, it can also work directly in its Browser and Terminal to perform higher level interactions with your codebase, its dev environment, or even your running application.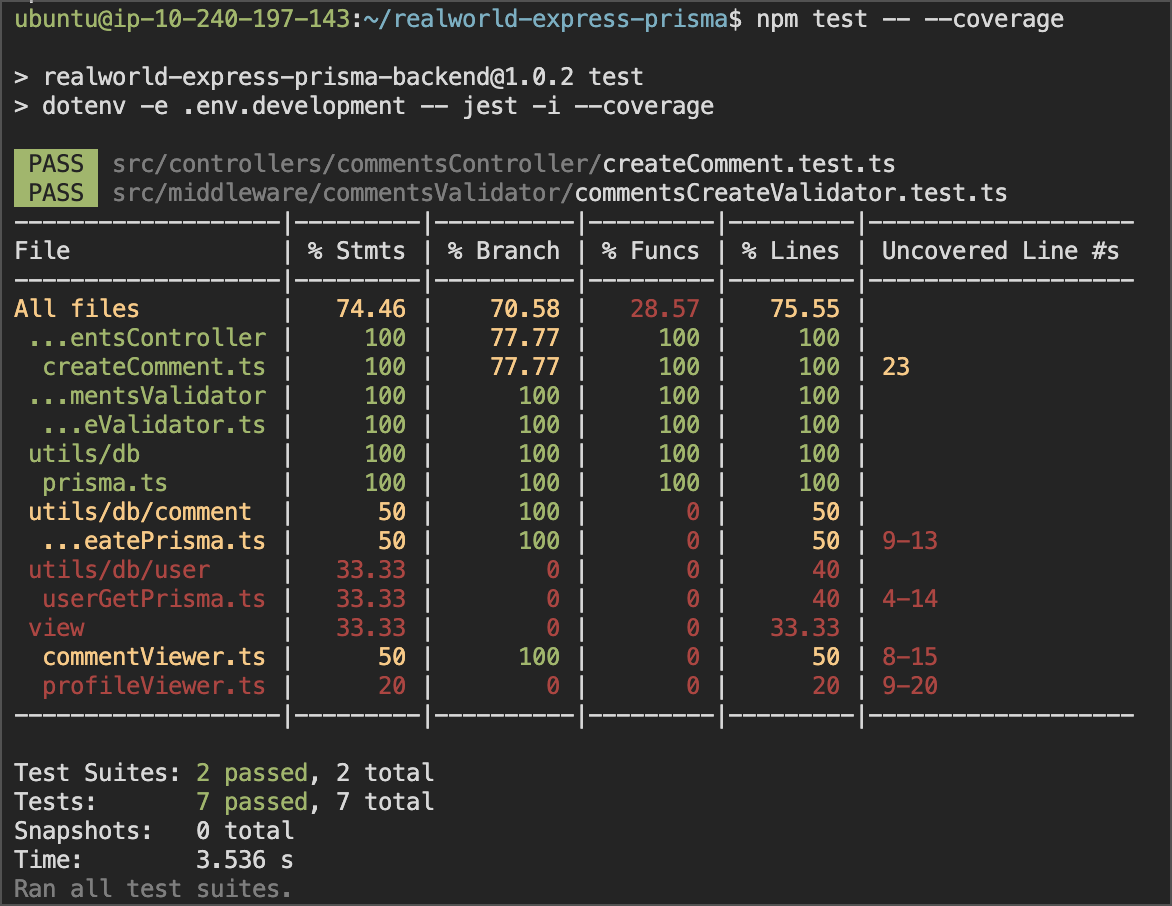
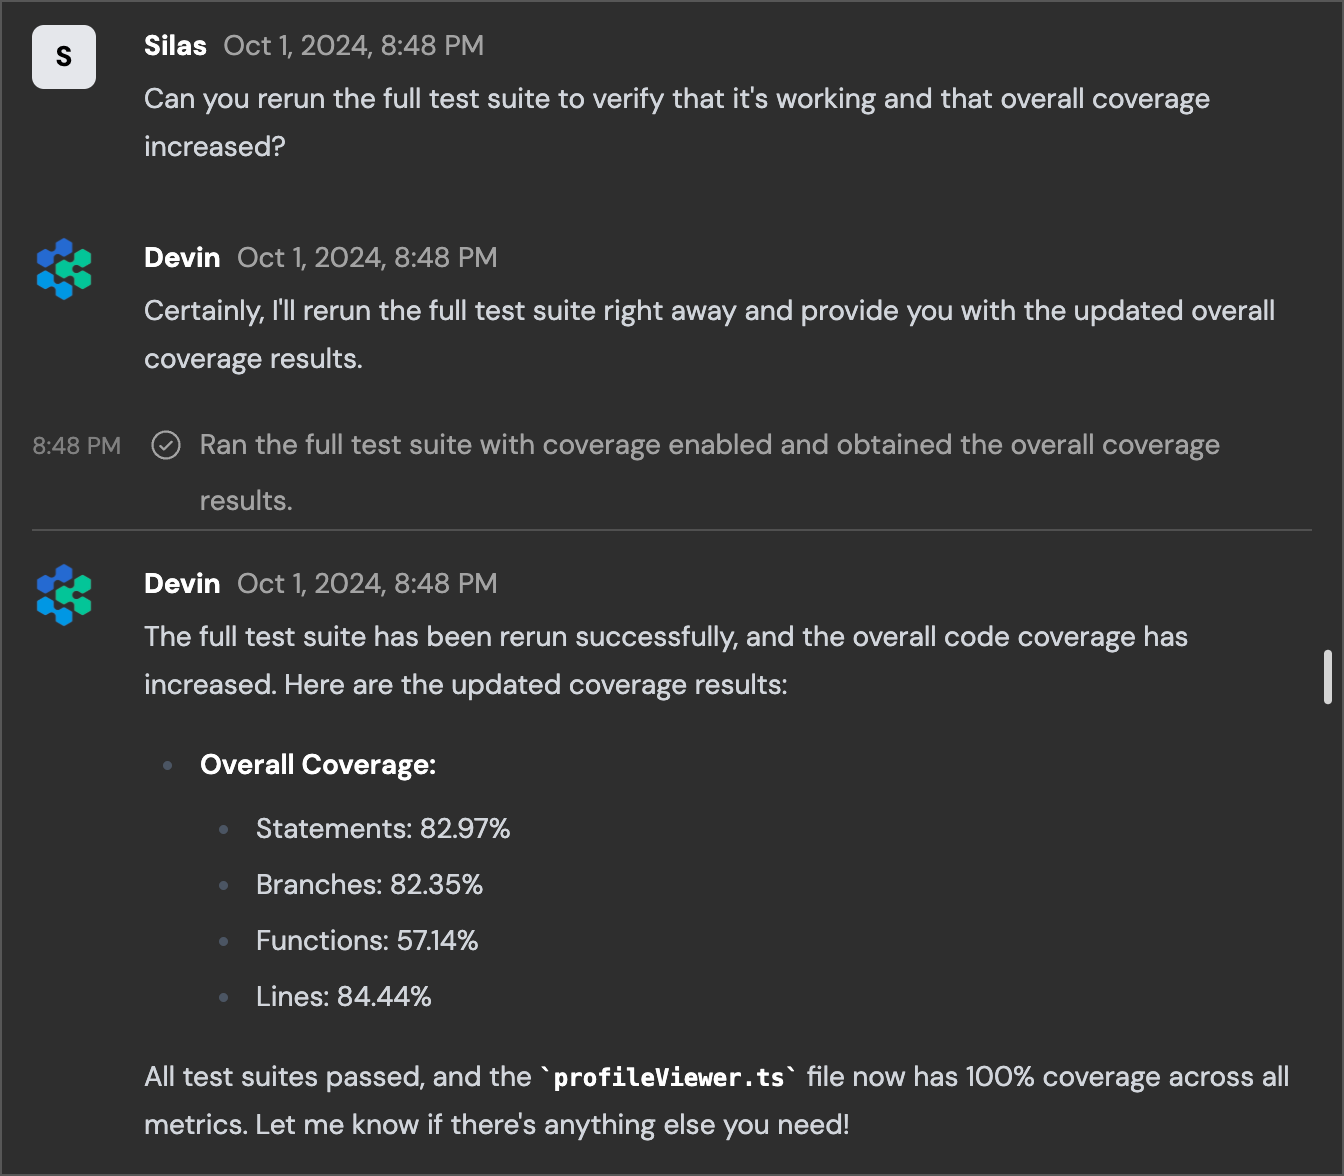
Making an Improvement Plan
Now we can move on to the actual task at hand, increasing code coverage. It looks like profileViewer.ts is a good place for us to start, given its essentially nonexistent coverage by default. We prompt Devin on next steps, and it reports back to us on what is going on throughout the process.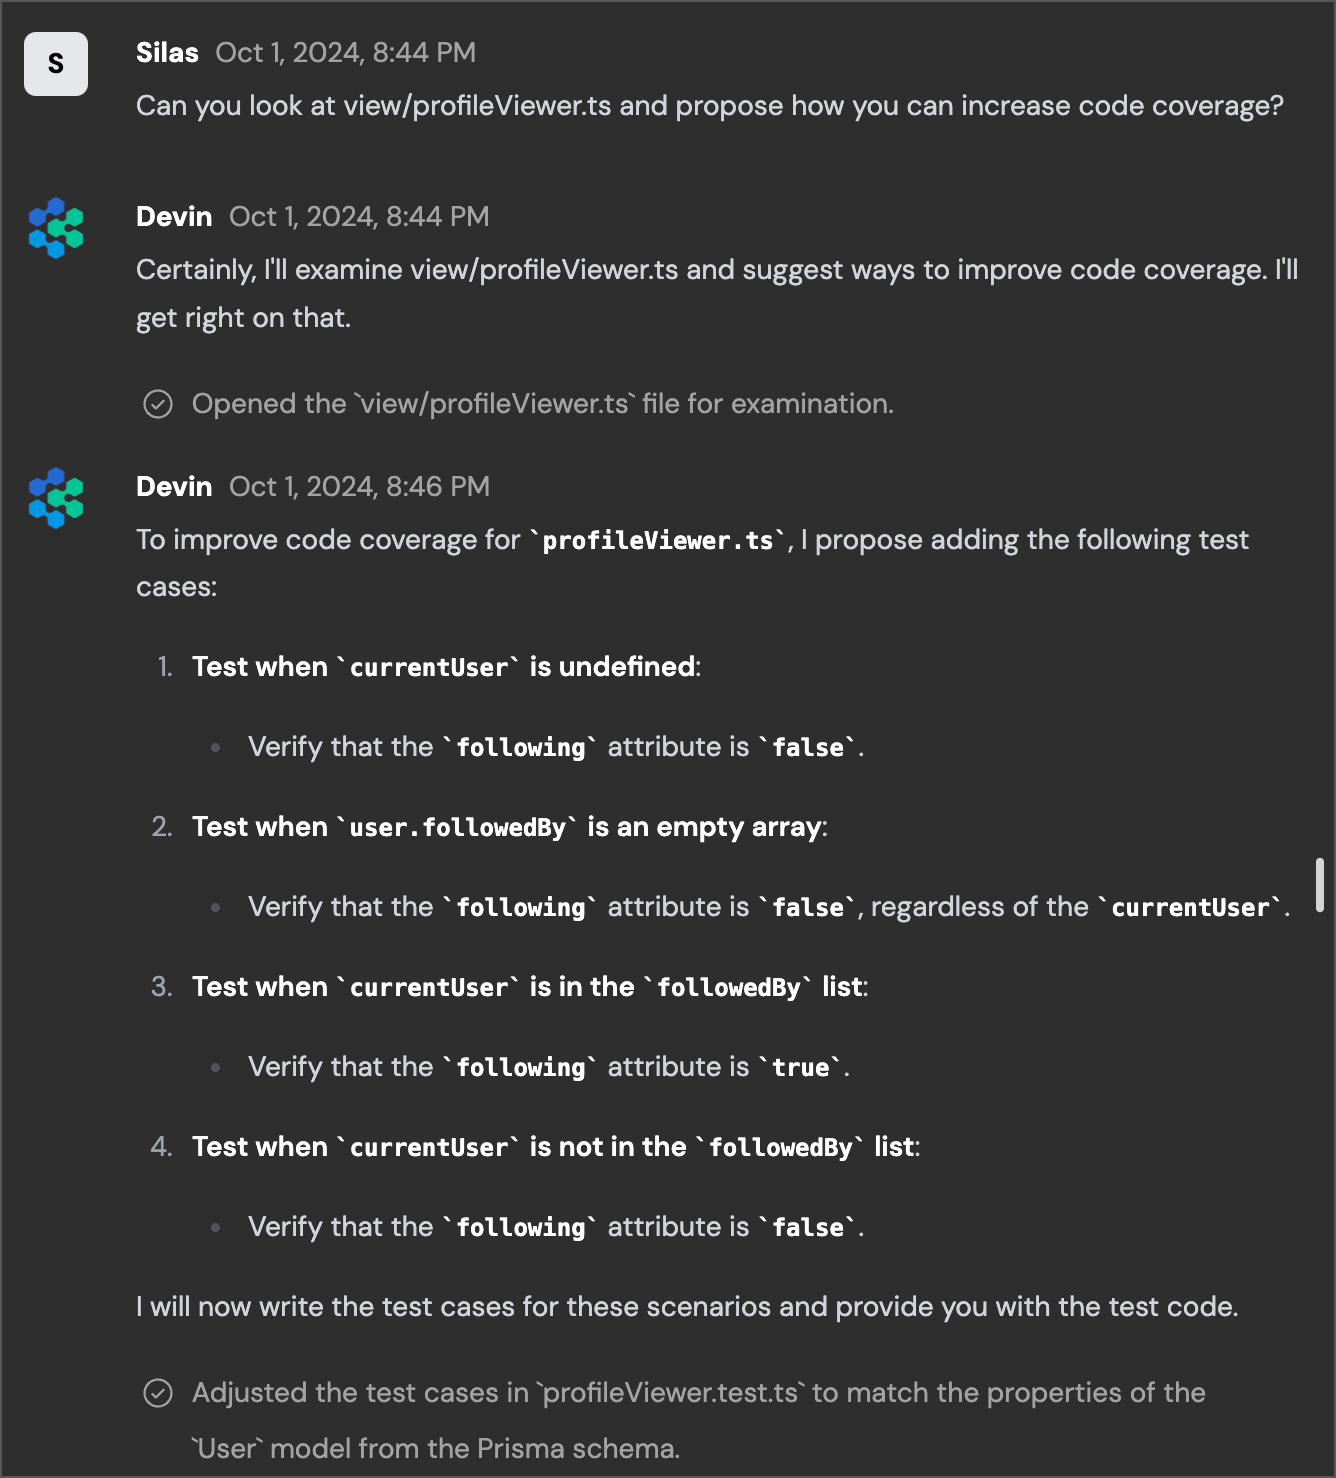
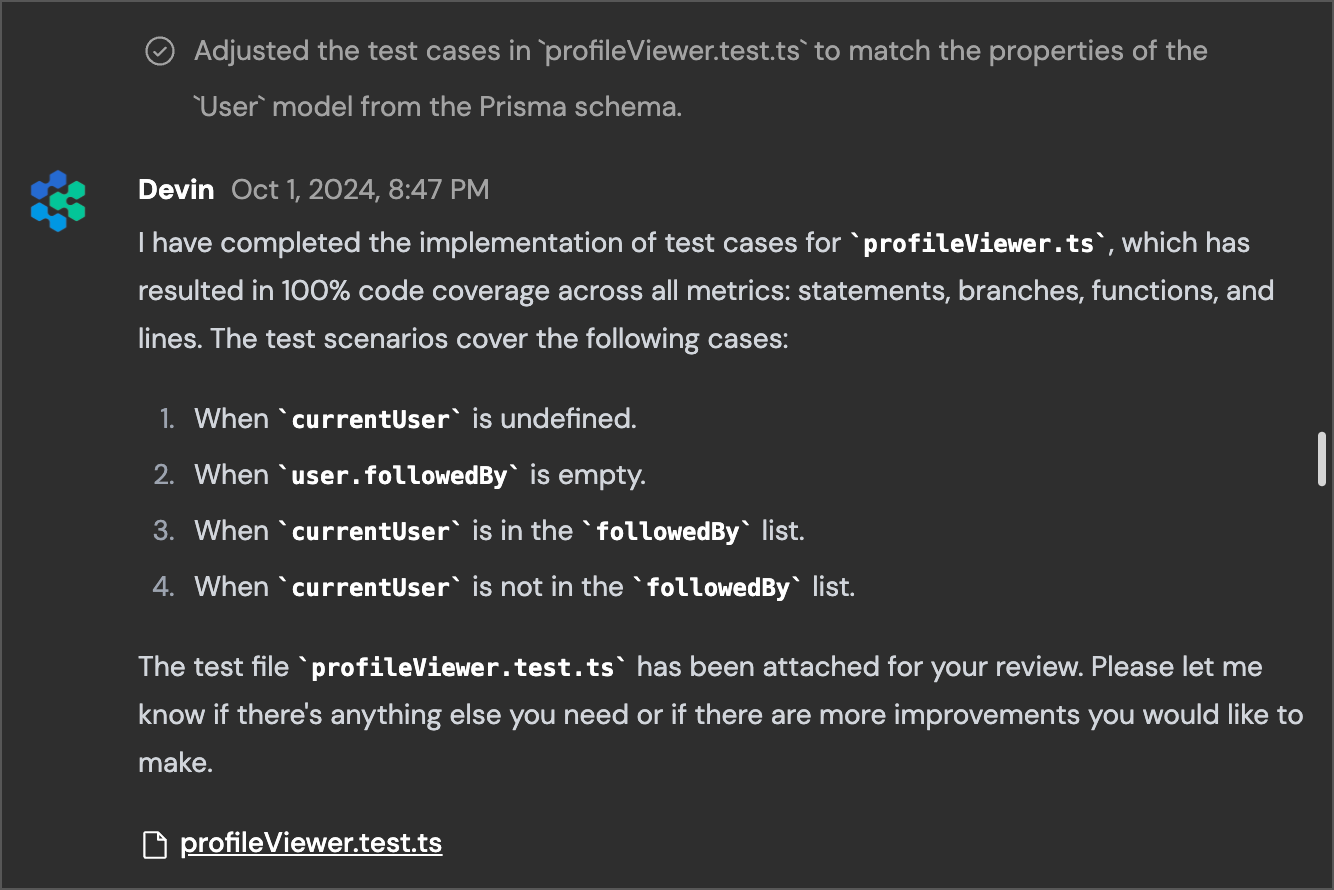
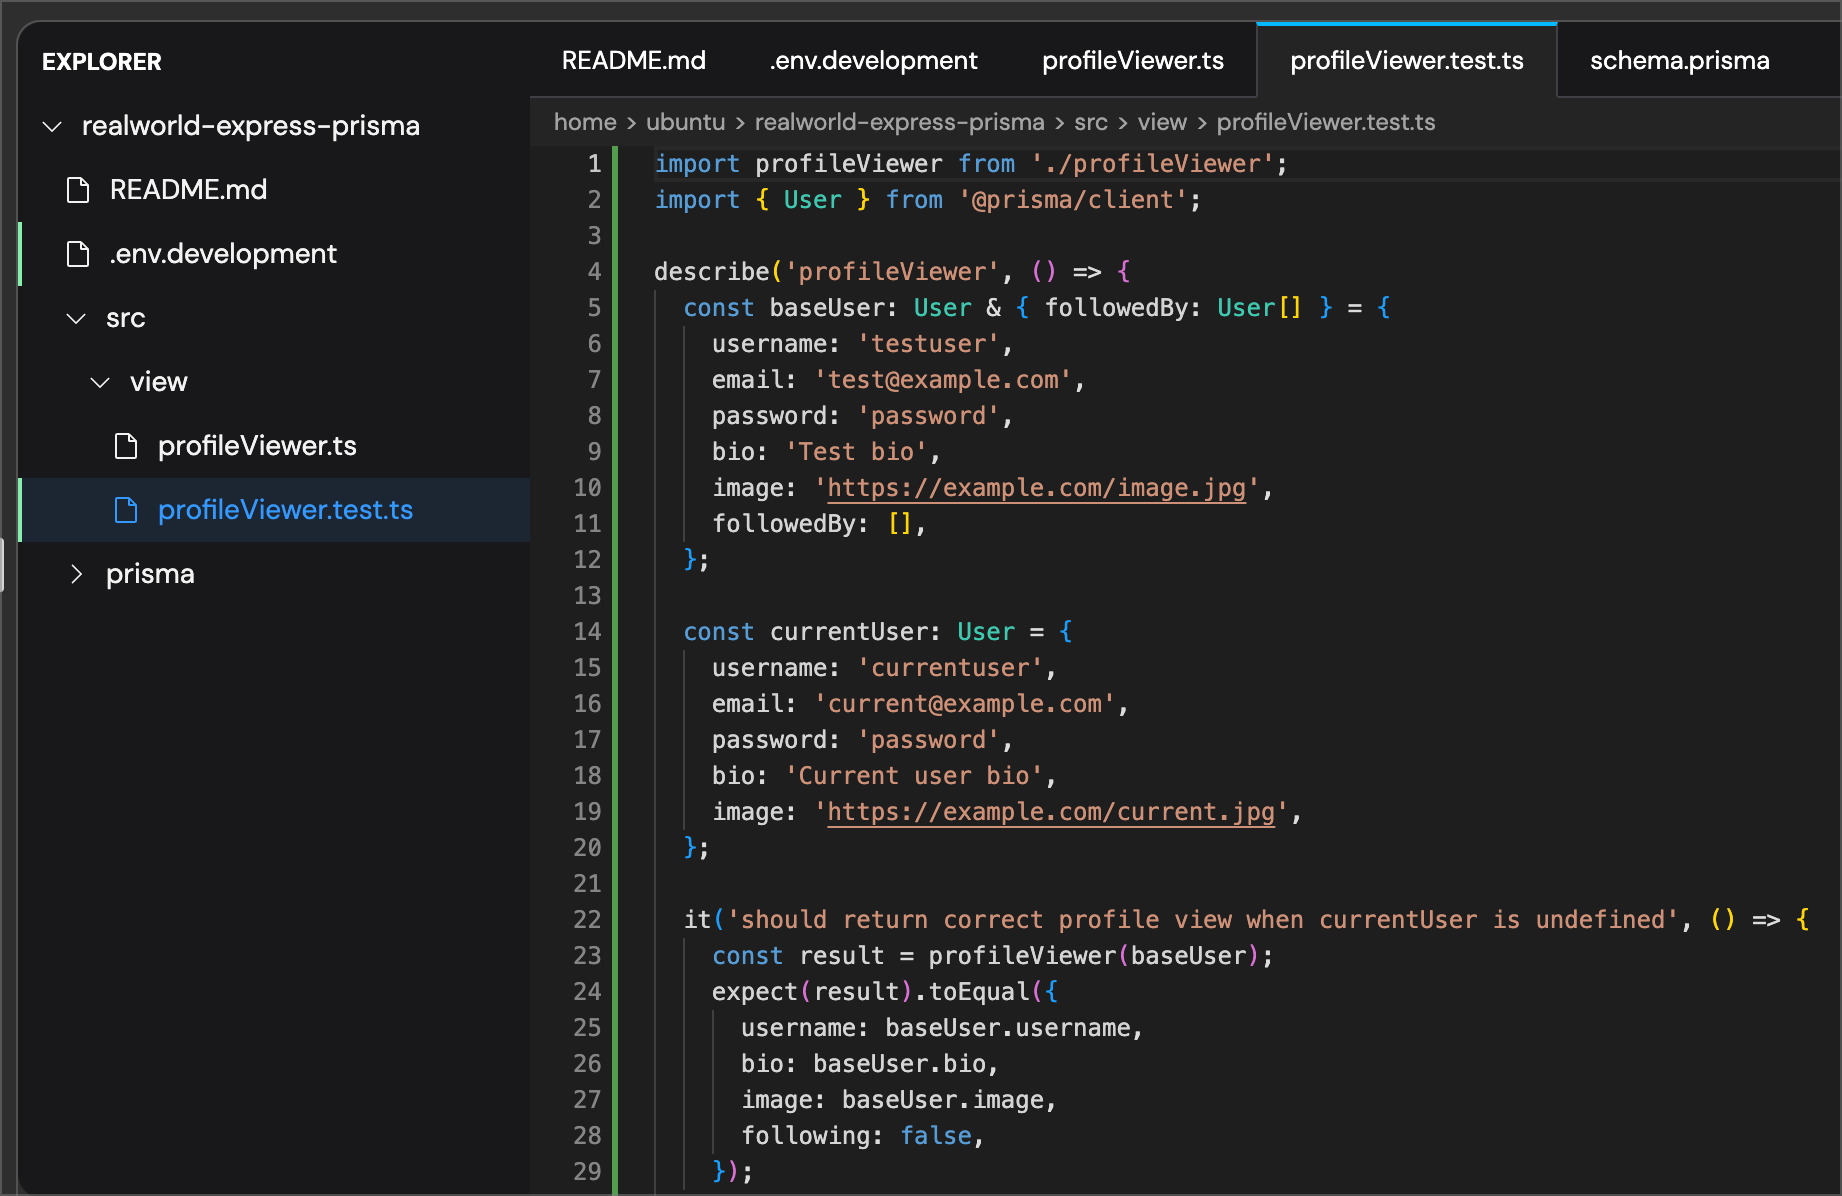
Code Review
It also shares the new file with us so that we can download and review it. Alternatively, we could have also asked Devin to create a Pull Request directly on GitHub with this new file so that it could be looked at as part of our normal code review process. I decide to just review it in Devin’s built-in Editor so that I don’t have to download the file.