JetBrains IDE
- 本地
- Remote
Cascade 现已支持直接从 IDE 生成诊断文件,可通过以下两种方式:
- 在 Cascade 窗口中,点击右上角的 3 个点,然后选择 Download Diagnostics
- 在 IDE 菜单中,前往 Tools > Windsurf > Download Windsurf Diagnostics
VS Code
-
打开 Command Palette (
Ctrl/Cmd + Shift + P,或前往 View > Command Palette) - 输入“Show logs”,然后选择“Developer: Show Logs”选项
- 点击右上角当前显示为“Extension Host”的下拉菜单,然后选择“Windsurf”
- 你应该会看到与下图类似的内容:
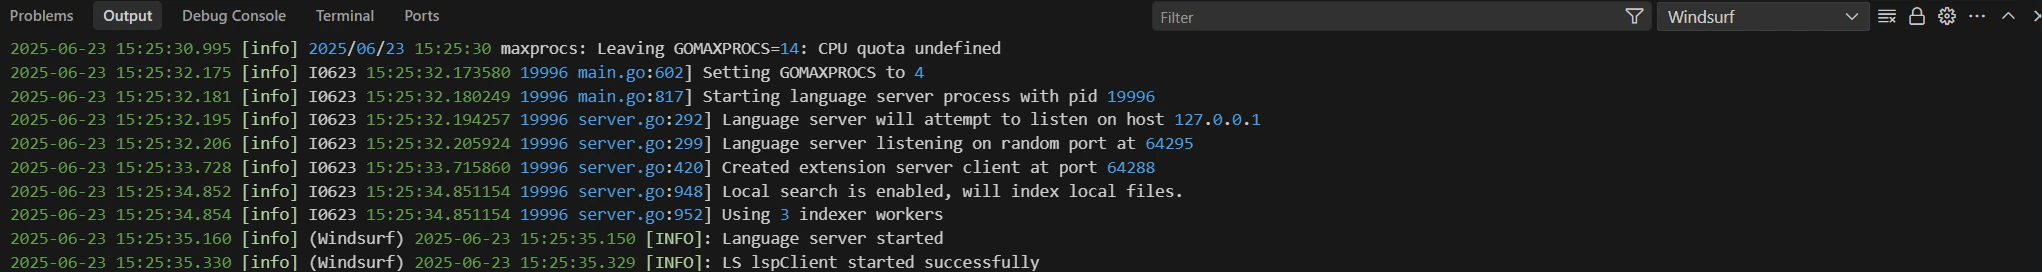
- 导出或复制日志
Eclipse
- Mac/Linux: ~/.codeium/codeium.log
- Windows:
C:\Users\<username>\.codeium\codeium.log
Visual Studio
NeoVim
g:codeium_log_file 设置为某个文件路径,然后重新启动 vim。
随后,logs 就会写入该文件。