> ## Documentation Index
> Fetch the complete documentation index at: https://docs.devin.ai/llms.txt
> Use this file to discover all available pages before exploring further.
# Devin Session Tools
> Complete guide to Devin's IDE, Browser, and Shell tools
Devin provides three powerful tools during sessions that allow you to monitor, interact with, and take over Devin's work: the Shell, IDE, and Browser. These tools work together to give you full visibility and control over Devin's development environment. The Progress tab brings these tools together in one unified view, giving you clear visibility into Devin’s ongoing work.
## Progress Tab
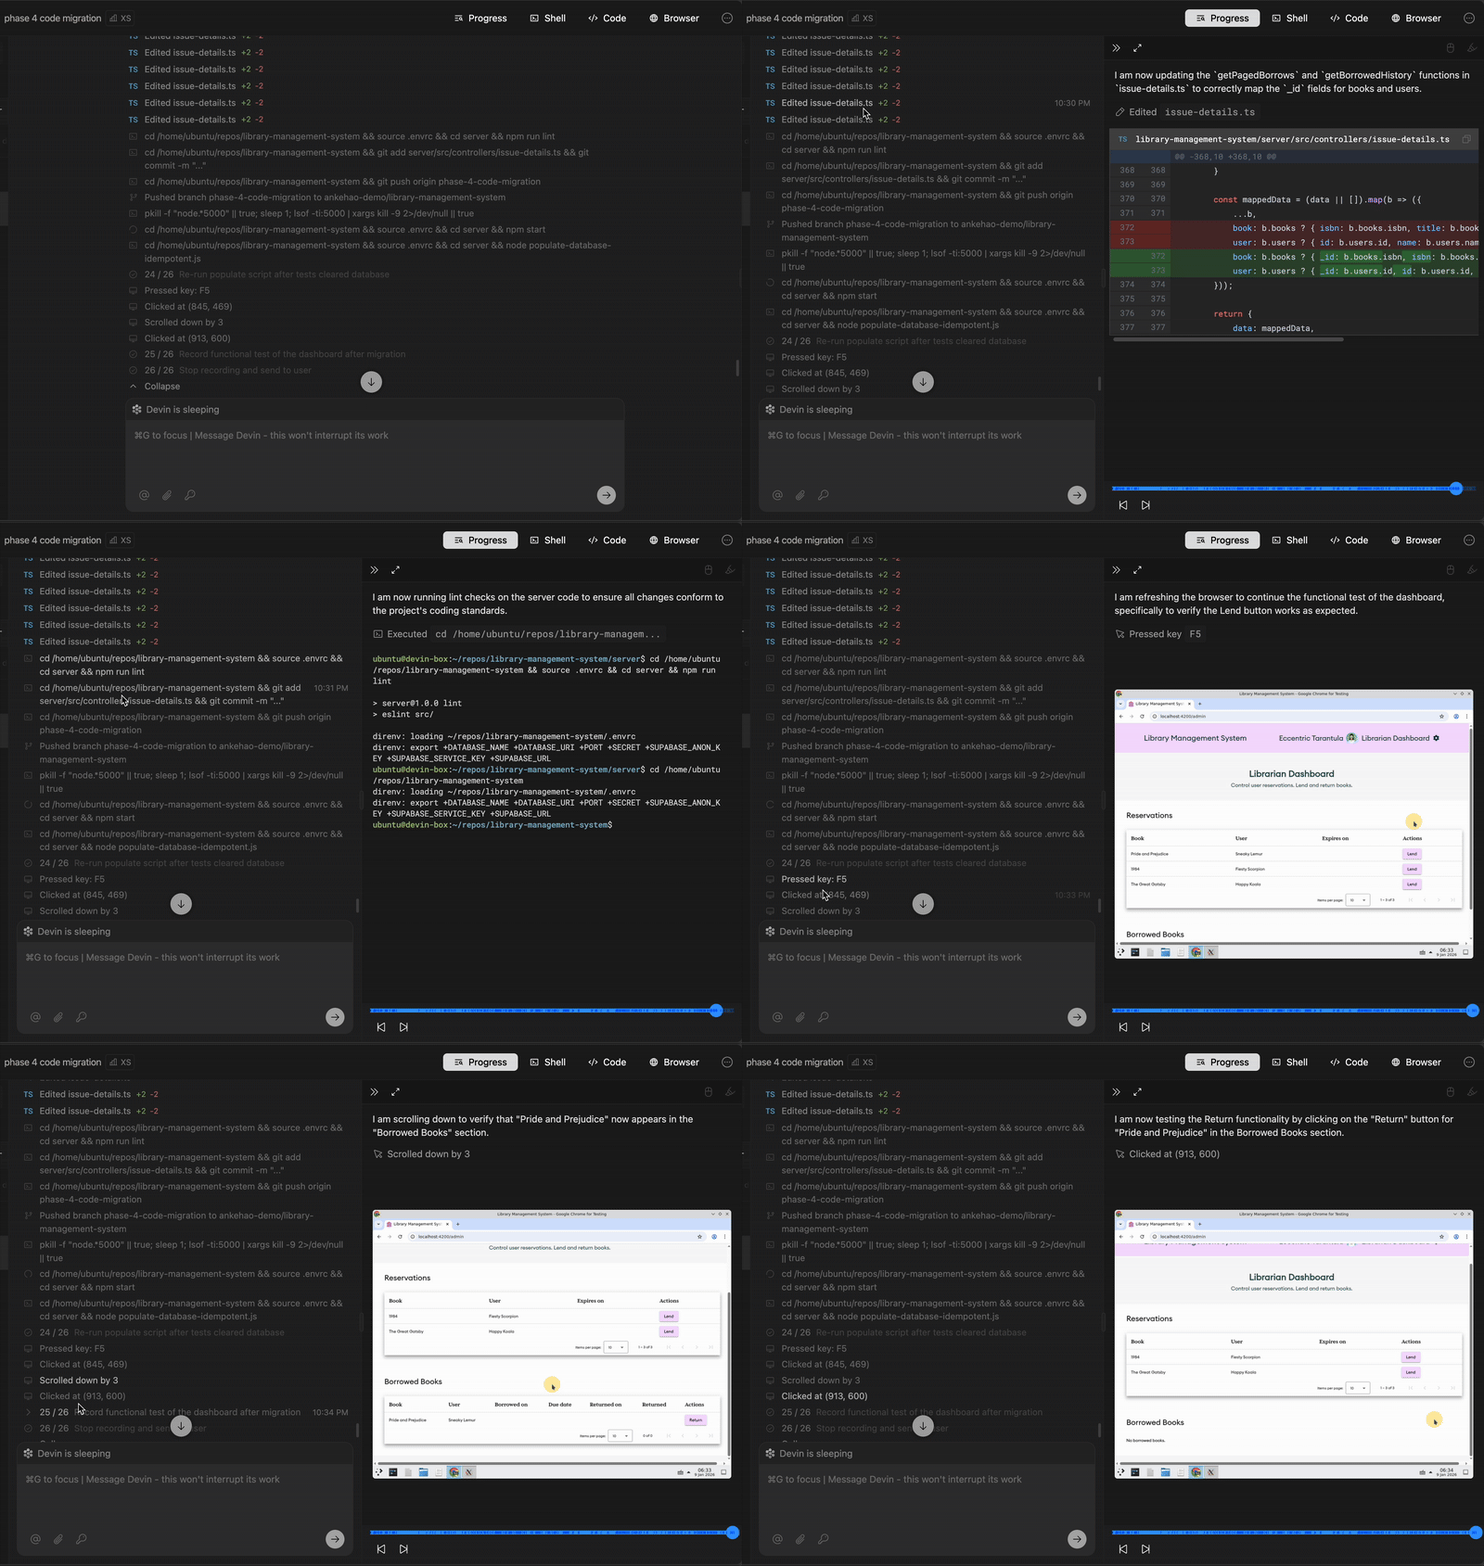
You can click on any of the steps within a Devin session or click the Progress tab to view the details of that step. All shell commands, code edits, and browser activity will be logged in one unified view.
 ## Shell & Terminal
Devin's shell provides full command-line access to the development environment. You can monitor Devin's commands, view outputs, and run your own commands when needed.
### Command history features
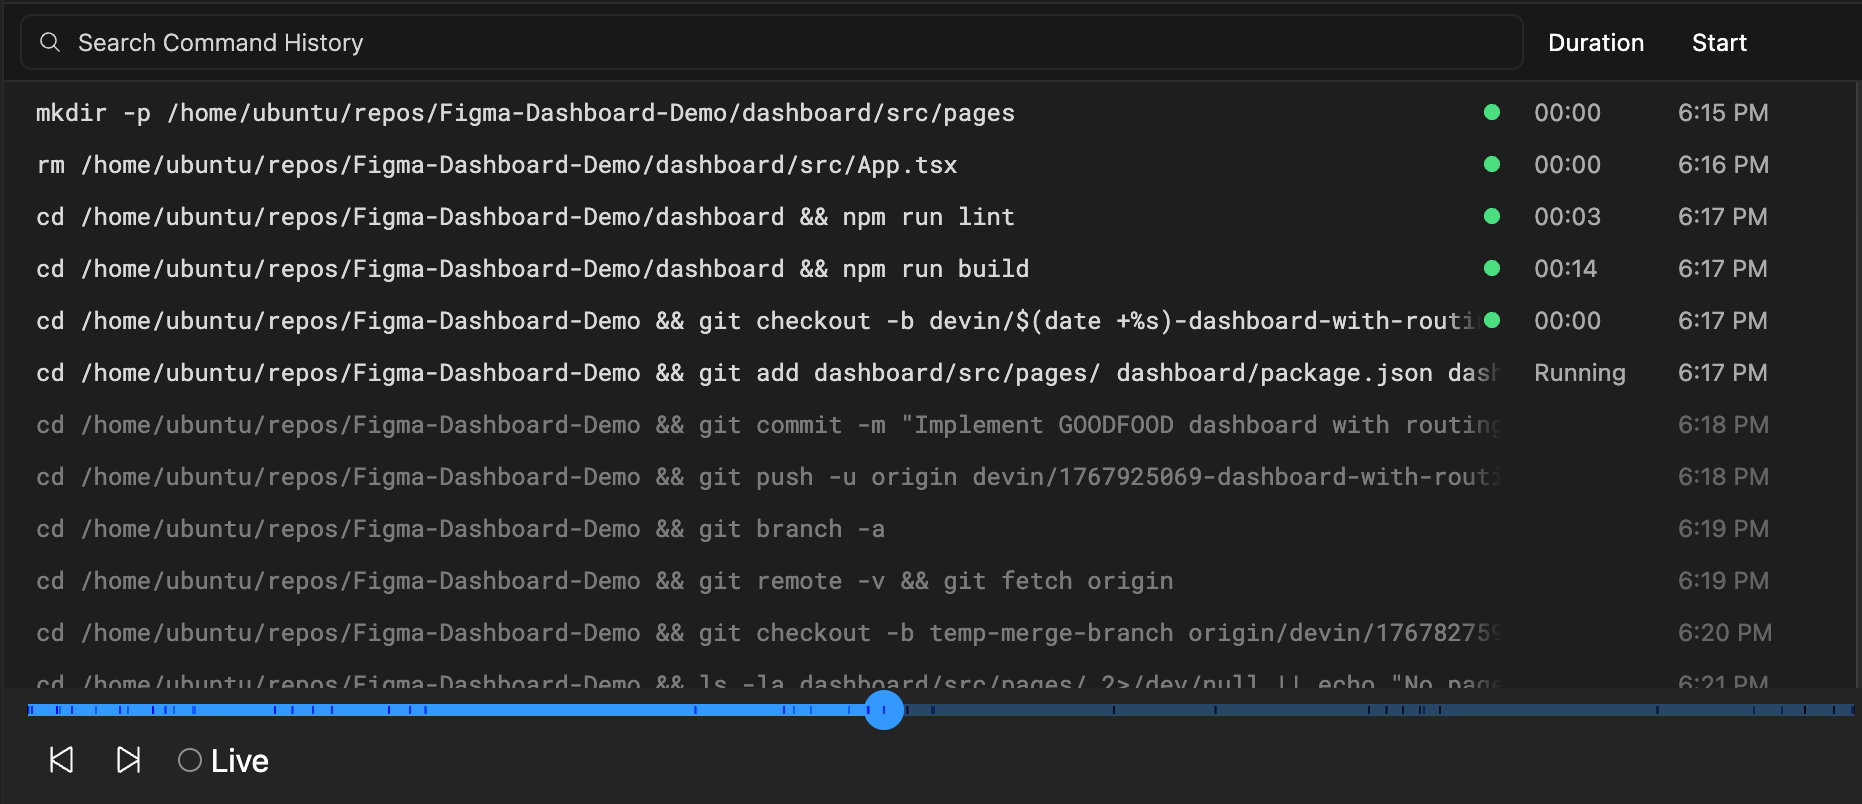
With command history, you can easily see a list of all the commands that Devin ran, along with a preview of their outputs. Key features include:
* **Full command list**: View every command Devin has executed during the session
* **Output preview**: See the output of each command without switching contexts
* **Copy functionality**: Quickly copy commands and outputs to your clipboard
* **Time navigation**: Jump to different points in the session by clicking on commands
* **Integration with progress updates**: Shell commands are linked to Devin's progress updates for context
## Shell & Terminal
Devin's shell provides full command-line access to the development environment. You can monitor Devin's commands, view outputs, and run your own commands when needed.
### Command history features
With command history, you can easily see a list of all the commands that Devin ran, along with a preview of their outputs. Key features include:
* **Full command list**: View every command Devin has executed during the session
* **Output preview**: See the output of each command without switching contexts
* **Copy functionality**: Quickly copy commands and outputs to your clipboard
* **Time navigation**: Jump to different points in the session by clicking on commands
* **Integration with progress updates**: Shell commands are linked to Devin's progress updates for context
 ### View shell updates
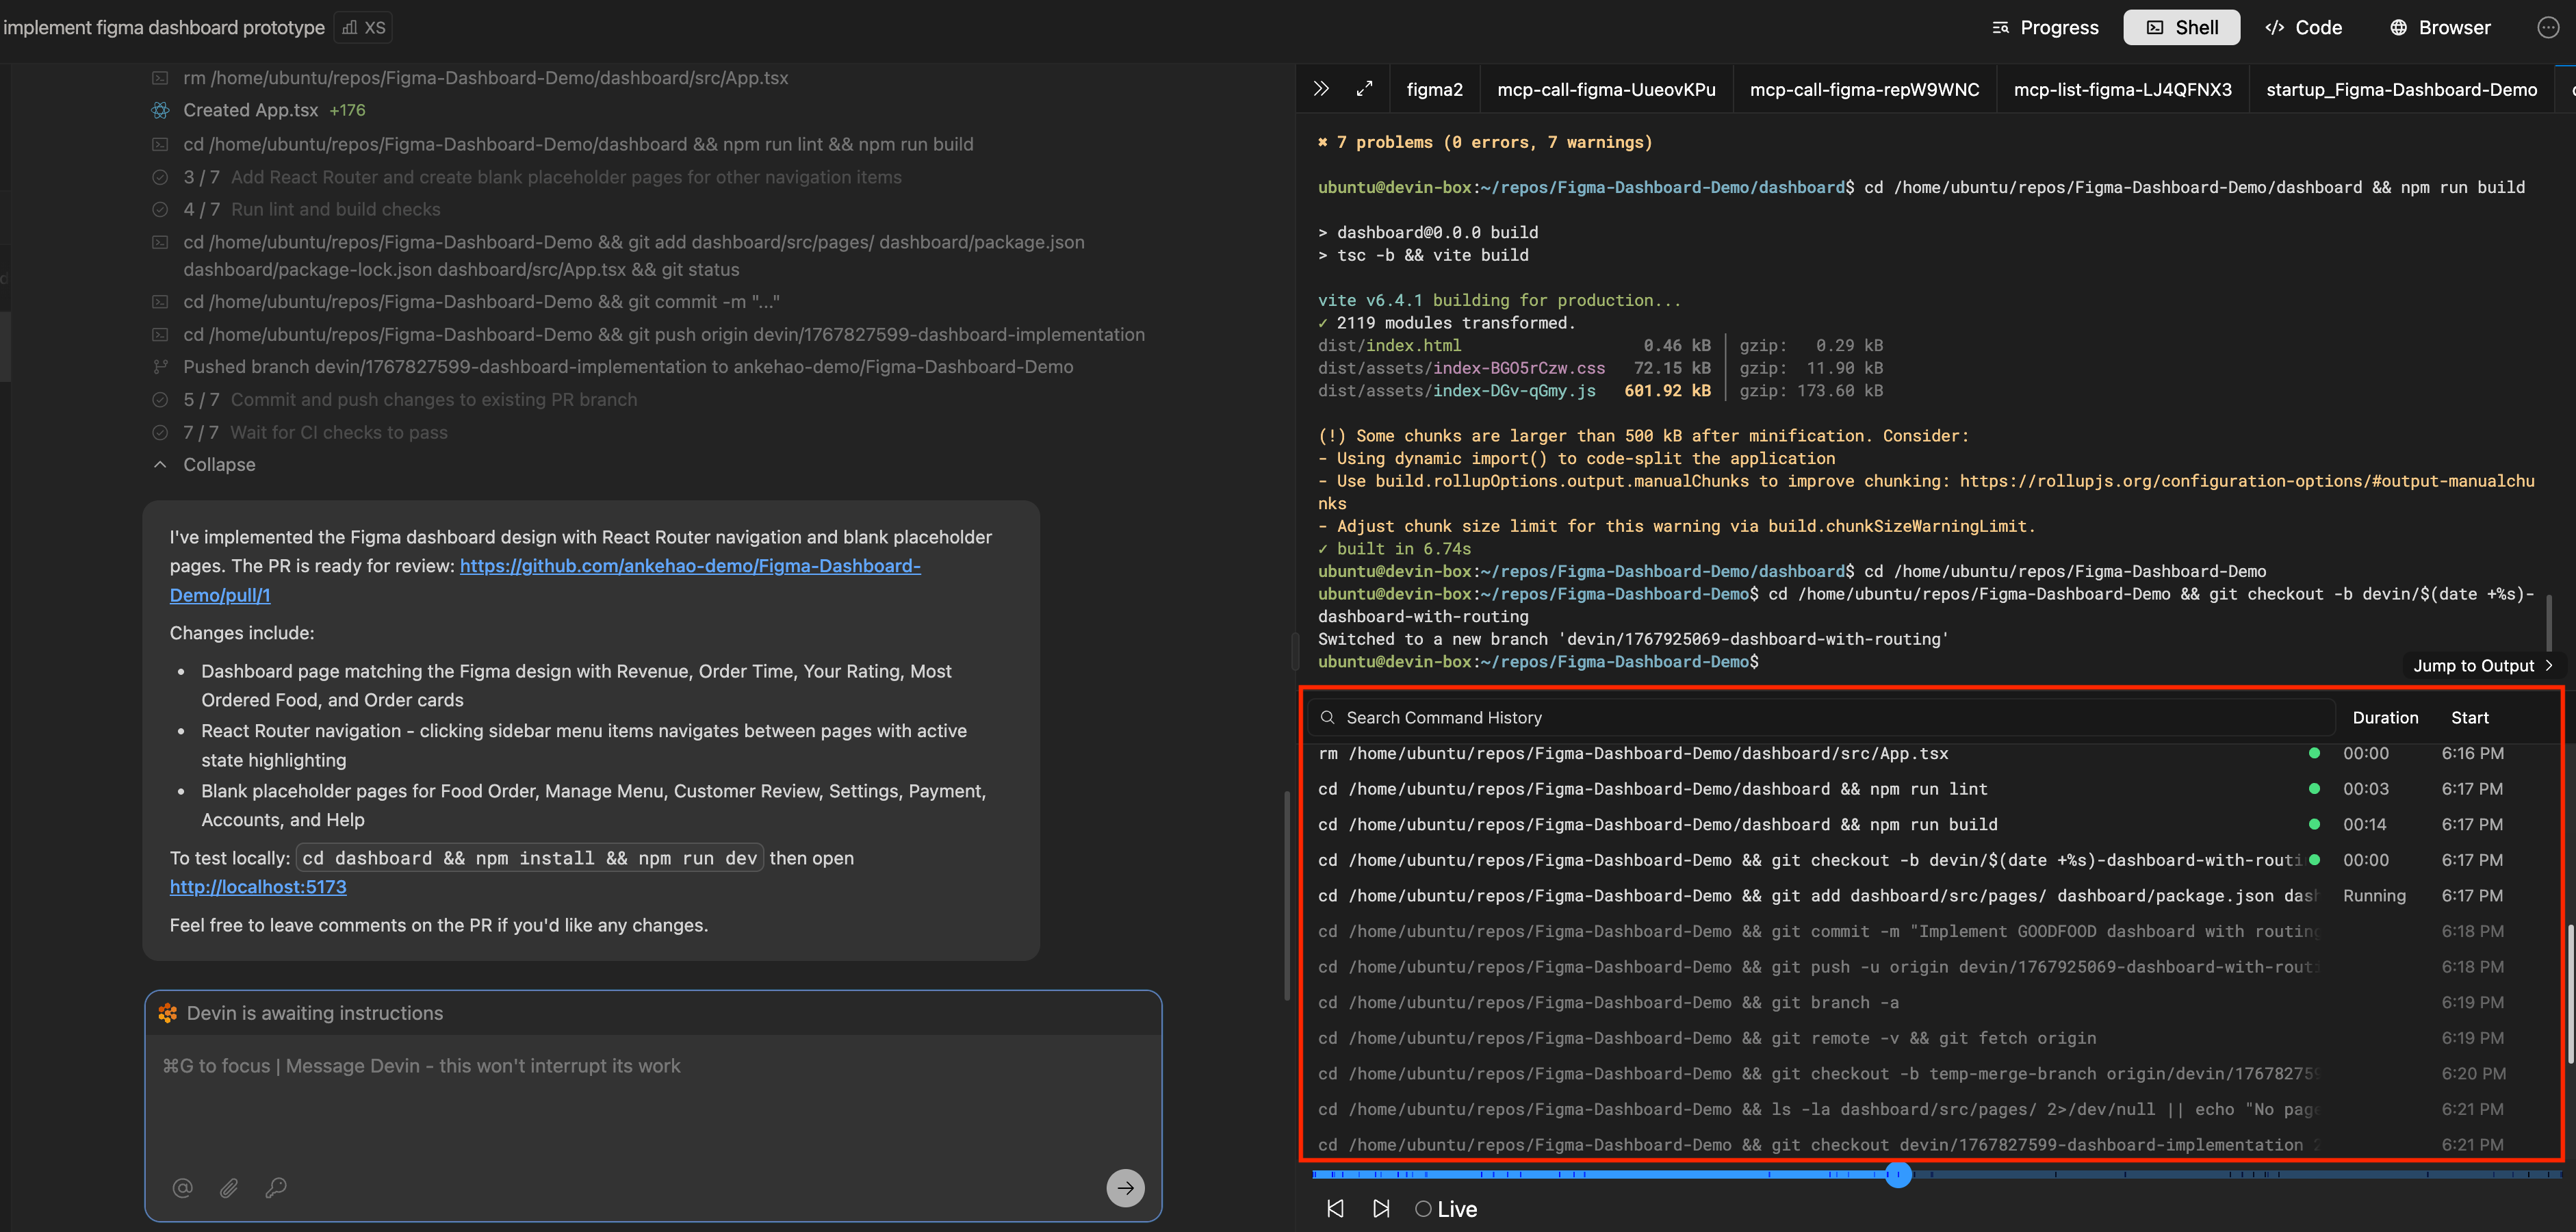
During a session, you can click into Devin's progress updates to view specific shell commands Devin used while working through sub-tasks. The progress view shows shell updates in context with the work being performed.
### View shell updates
During a session, you can click into Devin's progress updates to view specific shell commands Devin used while working through sub-tasks. The progress view shows shell updates in context with the work being performed.
 ### Shell command history
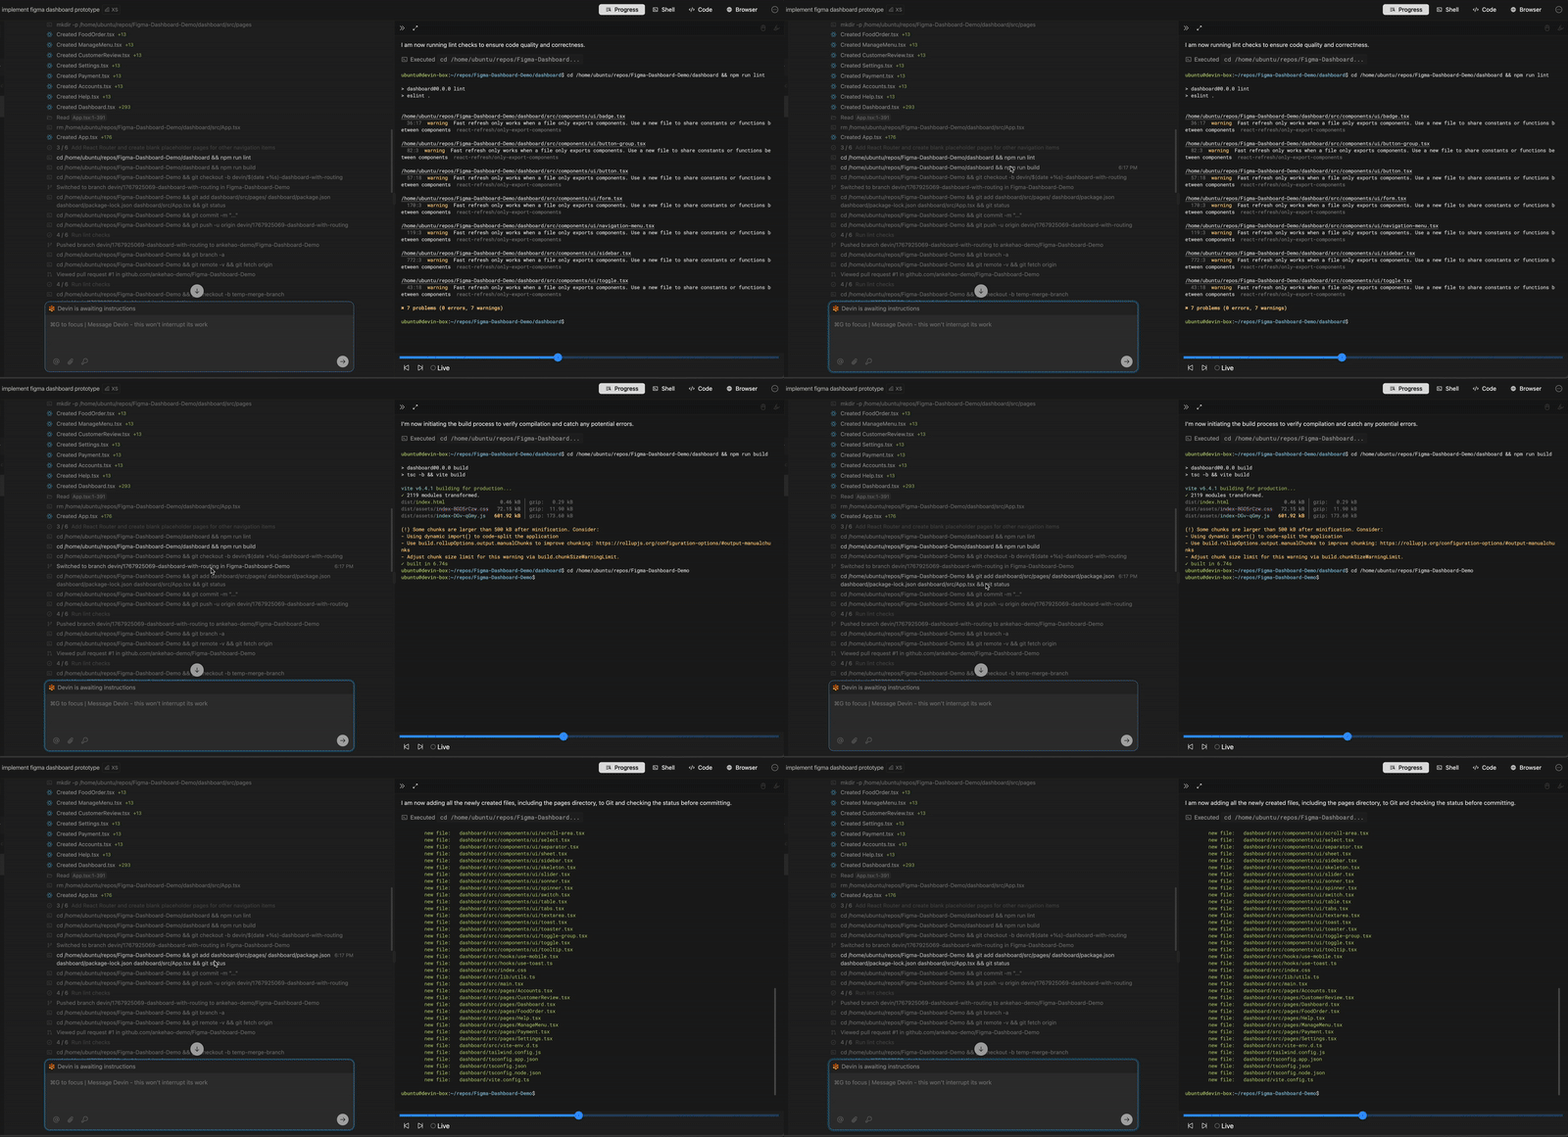
Shell updates show you the full command history and related outputs. You can easily copy a command and its output by clicking on the three-dots icon.
### Shell command history
Shell updates show you the full command history and related outputs. You can easily copy a command and its output by clicking on the three-dots icon.
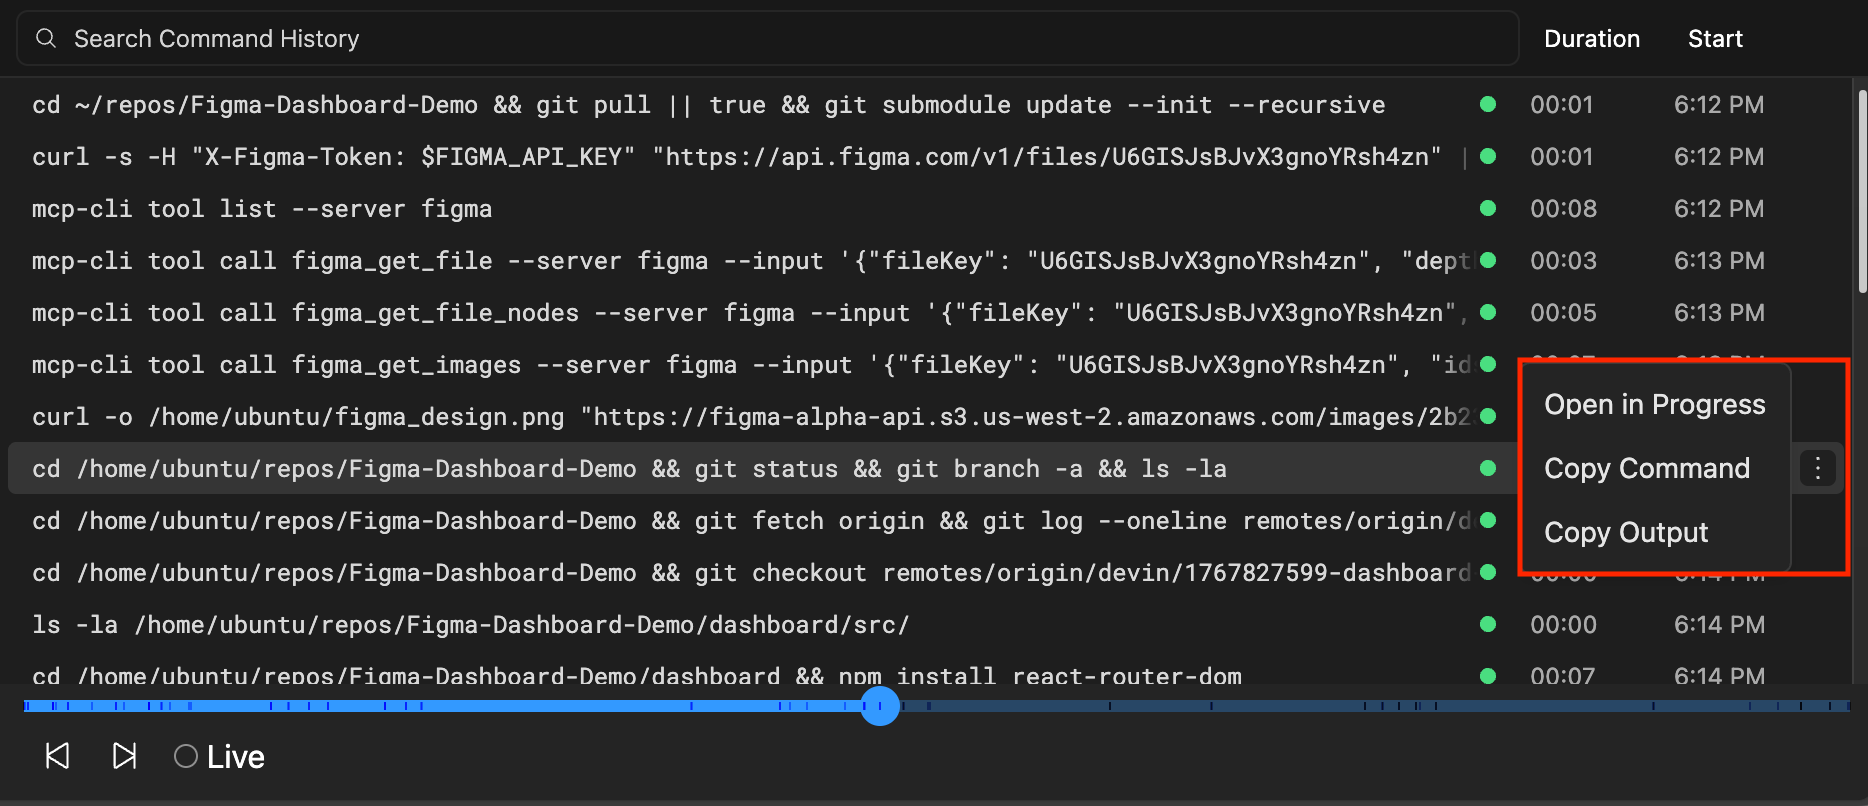 Commands that are greyed out are commands run at a future point in time in the session. You can jump to different points in time in the session by clicking on different commands in the Command History section.
 ### Running your own commands
When you take over Devin's machine, you have full terminal access. You can:
* Open a terminal in VSCode to run commands directly
* Toggle terminals from read-only to writable mode
* Run any commands you need to debug, test, or configure the environment
## Devin IDE
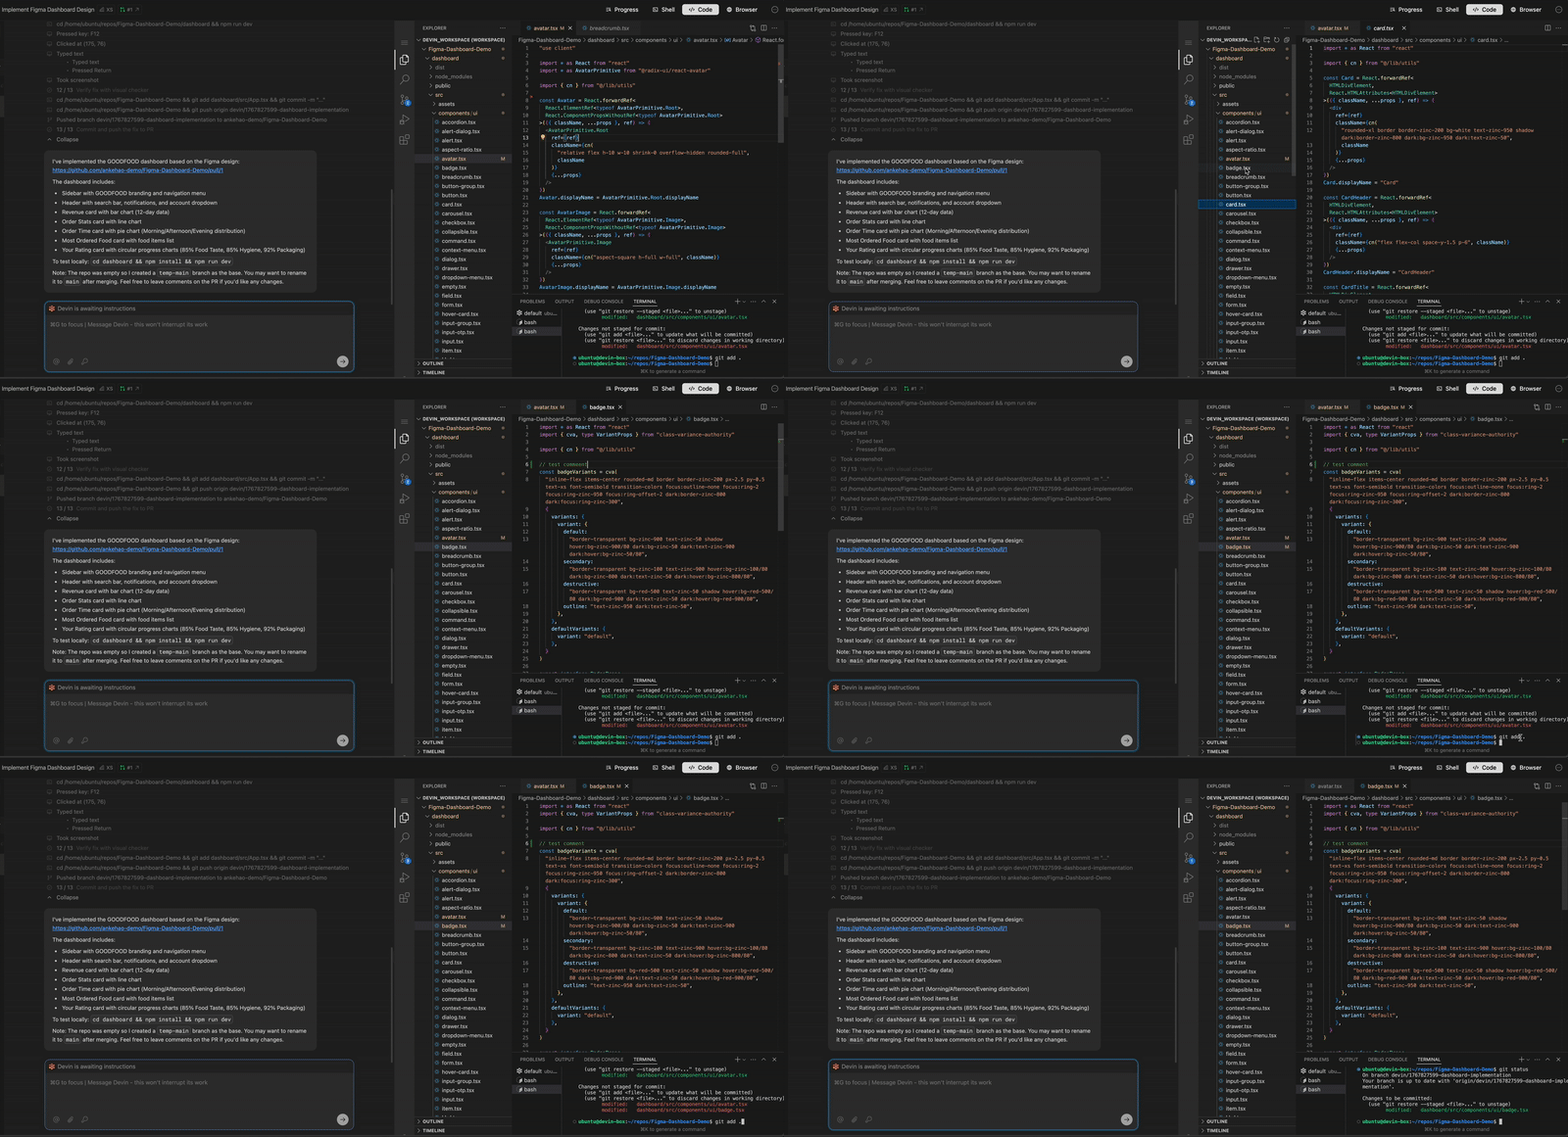
Devin works in an interactive VSCode environment loaded with your repos. You can check in on Devin's edits in real time, then touch up the changes or test Devin's code directly using the IDE tools and shortcuts you're familiar with.
### Running your own commands
When you take over Devin's machine, you have full terminal access. You can:
* Open a terminal in VSCode to run commands directly
* Toggle terminals from read-only to writable mode
* Run any commands you need to debug, test, or configure the environment
## Devin IDE
Devin works in an interactive VSCode environment loaded with your repos. You can check in on Devin's edits in real time, then touch up the changes or test Devin's code directly using the IDE tools and shortcuts you're familiar with.
 ### Reviewing Devin's work in real-time
You can watch Devin make edits in real-time. You're in a fully featured IDE complete with all your favorite shortcuts, so you can open files in new tabs, jump to definition, and more.
### Taking over Devin's task
Devin's IDE allows you to take over Devin's work when necessary, test and fix changes end-to-end without leaving the Devin webapp. Click to stop the session to take over and start using the IDE yourself. Many favorite commands are available in the IDE including:
* **Cmd/Ctrl+K** to generate terminal commands from natural language
* **Cmd/Ctrl+I** for rapid responses to questions or rapid file edits
* **Tab autocomplete** for code completion
All of Devin's terminals, commands, and their outputs are available in VSCode. Toggle from read-only to writable to run your own commands.
### IDE best practices
When taking over Devin's work, keep these tips in mind:
* Let Devin know about the changes you've made when you resume the session
* Make sure that Devin is paused before taking over the IDE to avoid simultaneous, conflicting changes
* Use Devin's browser to test the local build yourself, without leaving the webapp
## Interactive Browser
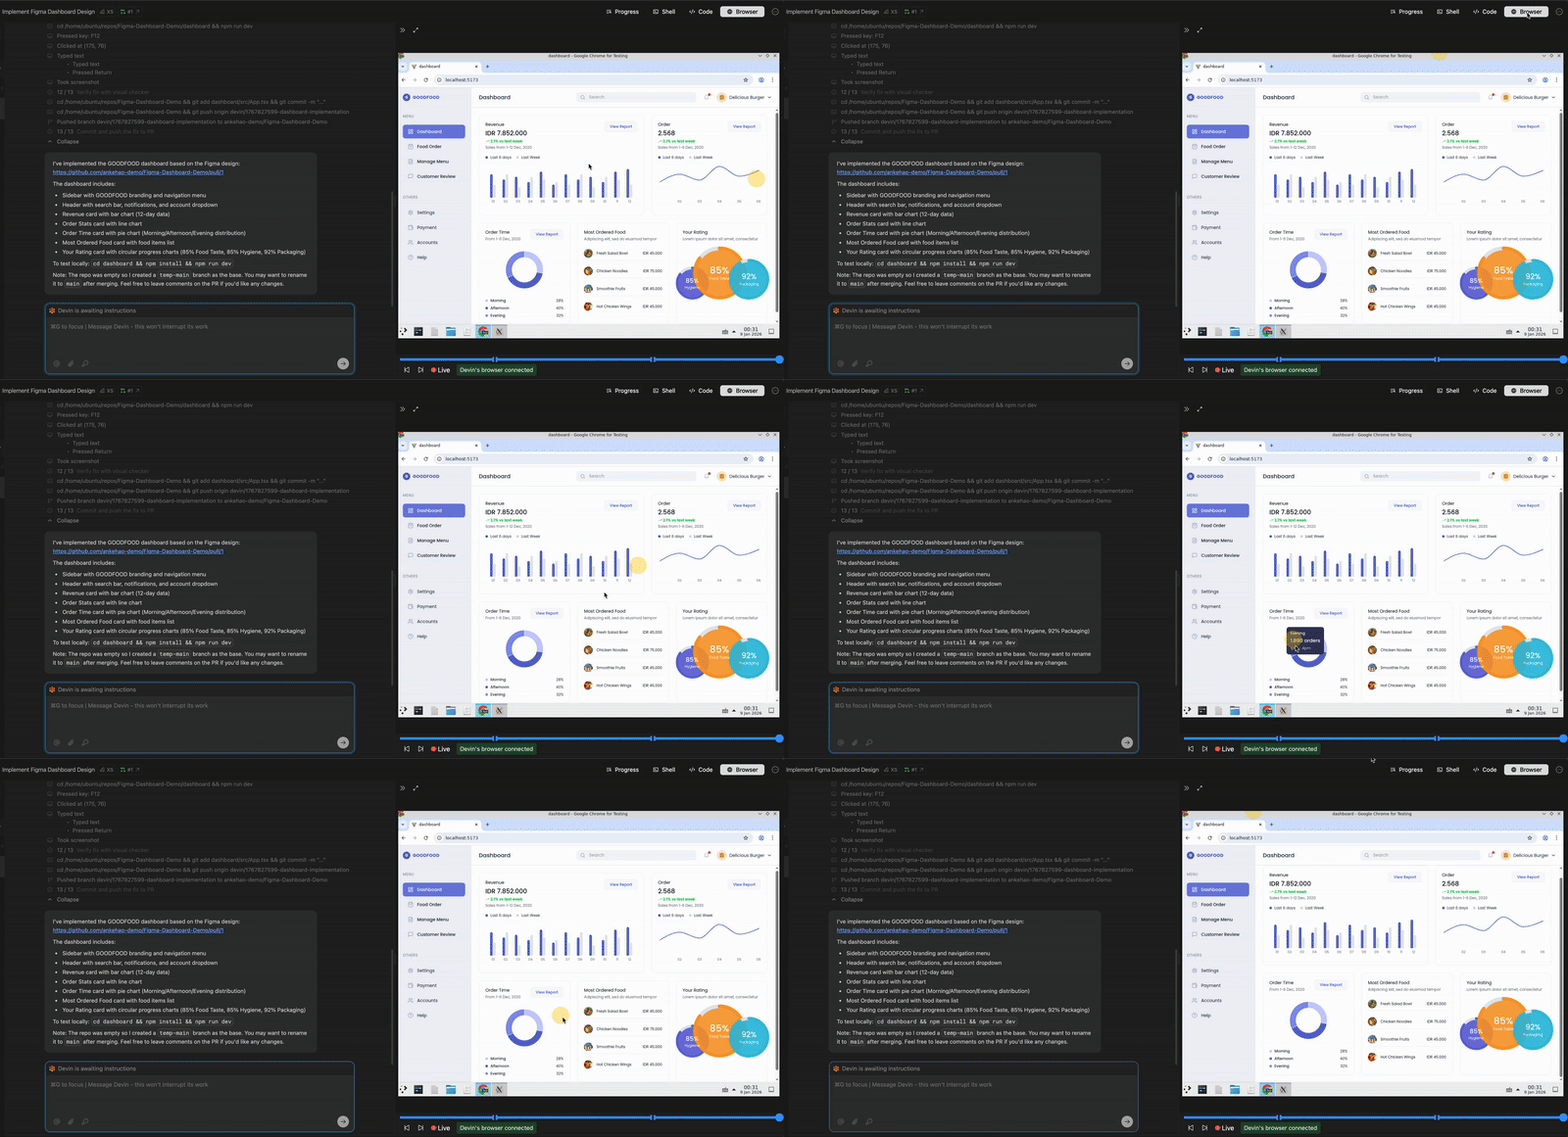
The Interactive Browser is located under the **Desktop** tab in the session UI. It allows you to directly view and interact with Devin's browser and desktop environment. This feature is especially helpful for browser tasks where Devin may require assistance, such as completing CAPTCHAs, completing multi-factor authentication steps, navigating complex websites, and more.
The tab was previously called "Browser" and has been renamed to "Desktop" to reflect Devin's full desktop environment capabilities.
### Reviewing Devin's work in real-time
You can watch Devin make edits in real-time. You're in a fully featured IDE complete with all your favorite shortcuts, so you can open files in new tabs, jump to definition, and more.
### Taking over Devin's task
Devin's IDE allows you to take over Devin's work when necessary, test and fix changes end-to-end without leaving the Devin webapp. Click to stop the session to take over and start using the IDE yourself. Many favorite commands are available in the IDE including:
* **Cmd/Ctrl+K** to generate terminal commands from natural language
* **Cmd/Ctrl+I** for rapid responses to questions or rapid file edits
* **Tab autocomplete** for code completion
All of Devin's terminals, commands, and their outputs are available in VSCode. Toggle from read-only to writable to run your own commands.
### IDE best practices
When taking over Devin's work, keep these tips in mind:
* Let Devin know about the changes you've made when you resume the session
* Make sure that Devin is paused before taking over the IDE to avoid simultaneous, conflicting changes
* Use Devin's browser to test the local build yourself, without leaving the webapp
## Interactive Browser
The Interactive Browser is located under the **Desktop** tab in the session UI. It allows you to directly view and interact with Devin's browser and desktop environment. This feature is especially helpful for browser tasks where Devin may require assistance, such as completing CAPTCHAs, completing multi-factor authentication steps, navigating complex websites, and more.
The tab was previously called "Browser" and has been renamed to "Desktop" to reflect Devin's full desktop environment capabilities.
 ### Browser use cases
The Interactive Browser is particularly useful for:
* **Testing local applications**: Test your application running on Devin's machine directly in the browser
* **Visual verification**: Verify that UI changes look correct in the browser
* **Screenshots and recordings**: Devin can capture screenshots and videos of the browser and submit them back to you as proof of testing or to show results
* **Authentication flows**: Complete login steps, MFA challenges, or OAuth flows that Devin cannot handle automatically
* **CAPTCHA solving**: Manually solve CAPTCHAs when Devin encounters them
* **Complex navigation**: Help Devin navigate through complex web interfaces or multi-step forms
### Cookie persistence
When you interact with the browser during a session, cookies and session data persist throughout the session. This means you can log into services once and Devin will maintain that authenticated state for the remainder of the session.
## Integration & Workflow
The IDE, Browser, and Shell tools work together seamlessly to provide a complete development experience.
Devin can perform diverse batches of actions concurrently, such as viewing the browser while running a shell command while reading multiple code files. This parallel execution improves speed and efficiency.
### Typical workflow
A typical workflow using these tools might look like:
1. **Start a session** and let Devin begin working
2. **Monitor progress** using progress updates
3. **Check shell commands** to understand what Devin is executing
4. **Review quick code changes** in the IDE using the diff view
5. **Functional testing** prototypes (for frontend development)
6. **Take over if needed** by stopping Devin and using the IDE directly
7. **Resume Devin** after making your changes and informing Devin what you did
## Best Practices
### When to use each tool
| Tool | Best for |
| --------------------------------- | ----------------------------------------------------- |
| **IDE** | Reviewing code changes, making quick edits, debugging |
| **Desktop** (Interactive Browser) | Frontend prototyping, visual testing, authentication |
| **Shell** | Monitoring commands, running tests, debugging issues |
### Tips for effective collaboration
* **Intervene early**: If you see Devin going in the wrong direction, stop and redirect early
* **Leverage command history**: Use shell command history to understand what Devin has tried and what worked
* **Communicate changes**: If resuming the session, always tell Devin about any changes you made when taking over
### Browser use cases
The Interactive Browser is particularly useful for:
* **Testing local applications**: Test your application running on Devin's machine directly in the browser
* **Visual verification**: Verify that UI changes look correct in the browser
* **Screenshots and recordings**: Devin can capture screenshots and videos of the browser and submit them back to you as proof of testing or to show results
* **Authentication flows**: Complete login steps, MFA challenges, or OAuth flows that Devin cannot handle automatically
* **CAPTCHA solving**: Manually solve CAPTCHAs when Devin encounters them
* **Complex navigation**: Help Devin navigate through complex web interfaces or multi-step forms
### Cookie persistence
When you interact with the browser during a session, cookies and session data persist throughout the session. This means you can log into services once and Devin will maintain that authenticated state for the remainder of the session.
## Integration & Workflow
The IDE, Browser, and Shell tools work together seamlessly to provide a complete development experience.
Devin can perform diverse batches of actions concurrently, such as viewing the browser while running a shell command while reading multiple code files. This parallel execution improves speed and efficiency.
### Typical workflow
A typical workflow using these tools might look like:
1. **Start a session** and let Devin begin working
2. **Monitor progress** using progress updates
3. **Check shell commands** to understand what Devin is executing
4. **Review quick code changes** in the IDE using the diff view
5. **Functional testing** prototypes (for frontend development)
6. **Take over if needed** by stopping Devin and using the IDE directly
7. **Resume Devin** after making your changes and informing Devin what you did
## Best Practices
### When to use each tool
| Tool | Best for |
| --------------------------------- | ----------------------------------------------------- |
| **IDE** | Reviewing code changes, making quick edits, debugging |
| **Desktop** (Interactive Browser) | Frontend prototyping, visual testing, authentication |
| **Shell** | Monitoring commands, running tests, debugging issues |
### Tips for effective collaboration
* **Intervene early**: If you see Devin going in the wrong direction, stop and redirect early
* **Leverage command history**: Use shell command history to understand what Devin has tried and what worked
* **Communicate changes**: If resuming the session, always tell Devin about any changes you made when taking over